Financial Services Leaders Are Spending More—and More Strategically—on Automation in 2024
Uncover insights revealed by industry leaders' automation spending habits.
It’s clear that financial services firms see automation as a key technology priority this year and beyond.
Respondents to SMA’s 2024 State of Automation in Financial Services survey of 580 U.S.-based executives from the banking, credit union, and insurance sectors ranked automation’s importance to their organization’s success at an average of 8.5 out 10.
And they’re spending a lot on these efforts. More than half of all firms surveyed (55%) spent $250,000 or more on automation in the past year. And among automation leaders—those organizations with 80% or more of their operations automated—that figure rises to nearly 8 in 10 (79%).
Yet despite this existing commitment, organizations are still looking to do more with automation.
According to SMA’s research, the median percentage range of operations currently automated is between 41-50%, while the median desired level of automation is between 61-70%.
To overcome this 20-point gap, financial services organizations are eyeing emerging technologies, particularly those that can handle the new demands of an increasingly complex and diverse technology stack.
And although automation is high on all firms’ technology priority lists for 2024, we’ve identified some significant differences in how automation leaders are able to leverage their automation budgets for maximum impact.

Which automation tools are hot…or not?
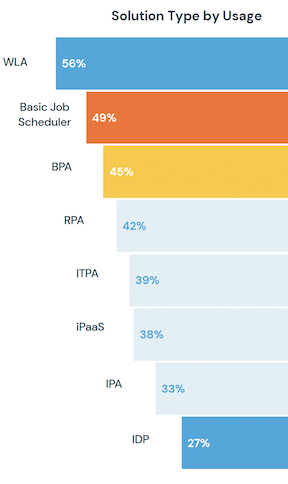
According to SMA’s State of Automation survey, workload automation (WLA) is the most popular automation tool, with 56% of respondents indicating they use it in their operations currently. It’s also among the most highly regarded, earning (alongside robotic process automation [RPA] and intelligent process automation [IPA]) the highest levels of satisfaction among respondents.

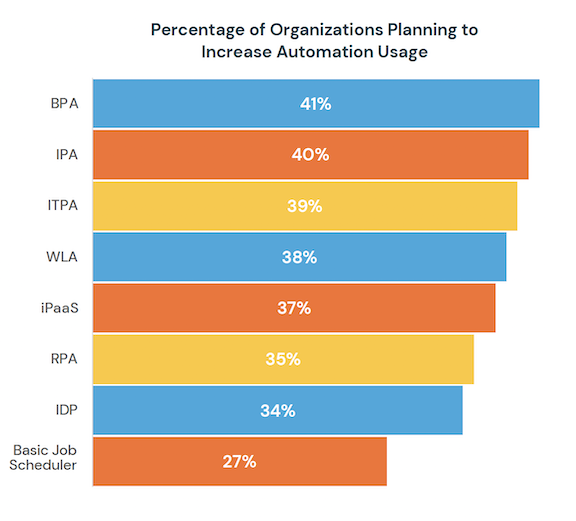
In addition to its current popularity, WLA remains core to organizations’ upcoming automation strategies, with 38% of respondents planning to increase their usage of this technology in the next year. This ongoing investment in WLA signals that modern platforms are effectively adapting with the changing needs of financial services organizations.
On the other end of the spectrum, basic schedulers are losing their luster.
Although schedulers are the second most widely used tool today according to our research, with 49% of organizations currently utilizing the technology, only 27% of respondents plan to increase their use of it in the future, placing it last among the eight most common automation tools.

This lack of confidence in basic job schedulers is reflective of the software’s limitations. In contrast to WLA, which remains viable despite its long-established roots, basic job schedulers simply cannot advance to the level of functionality required by today’s financial services organizations.
In addition to established automation tools like WLA, firms are increasingly exploring emerging technologies to boost their automation results.
Business process automation (BPA) is a tool used to automate complex business-critical processes and functions. For example, BPA may be used to capture documents from various sources and route them to the appropriate team for processing. It logged the third highest current usage at 45% of respondents and is among the highest spending categories in our survey.
Integration platform as a service (iPaaS) is another emerging automation tool—an event-driven form of automation for streamlining and integrating workflows across dissimilar systems. Despite lower rates of satisfaction as compared with more established technologies, iPaaS spending highlights the growing importance of this technology in digital transformation initiatives. Among the 38% of respondents that reported using iPaaS, 58% spent over $50,000 on this type of technology.
Leaders use similar automation tools but differently
Although the top-used automation tools were relatively consistent across all survey respondents, the State of Automation Report unearthed some major differences in how those tools are deployed.
To better understand this divergence, we split respondents into groups based on their level of current automation. We defined those respondents who have automated at least 80% of their operations as “automation leaders” and those who have automated a lower percentage of their operations than the median (41-50%, based on our survey) as “slow adopters.” Then we compared how these two groups are using emerging automation technologies, focusing on a few factors, including annual spend and satisfaction ratings.
We found some stark differences in how automation leaders and slow adopters utilize iPaaS in their operations. For one, the leaders make larger investments in this technology, with a median annual spend of between $100K and $250K, compared with just $25K to $50K for slow adopters.
This greater commitment resulted in much higher iPaaS satisfaction scores among leaders—8.64 on a scale of 1 to 10, versus just 7.02 for slow adopters.
It’s a similar story for BPA. Automation leaders spend in a median range of $50K-$100K annually on the tool, versus $25K-$50K for slow adopters. And leaders recorded significantly higher levels of satisfaction at 8.27 vs. 7.03.
Not only do automation leaders spend more on—and realize higher levels of satisfaction from—these automation tools. They implement automation tools with very different outcomes in mind.
When asked to name their top goals for automation, leaders cite business-focused objectives like “revenue growth,” “digital transformation,” and “better customer outcomes,” whereas slow adopters focus on more tactical goals like “cost savings” and “time savings.”
The bottom line
These findings show that automation leaders are particularly adept at understanding their organization’s strategic business goals and selecting the right automation tools to help meet these objectives. They are skilled at grasping the big picture, and grokking exactly how automation can be deployed effectively to achieve business goals like improving the customer experience, growing revenue, and achieving digital transformation.
Leaders also understand how to maximize the ROI on their existing automation investments, by optimizing their use of flexible, versatile tools like WLA, iPaaS, and BPA. This is a big reason why 69% of leaders reported cost savings of $100,000 or more each year from automation, compared with just 41% of slow adopters.
While most respondents reported impressive cost savings, firms may be missing out on even greater returns from implementing modern, integrated automation solutions, which have been shown to save companies an average of $375,000 or more every year.*
Automation leaders have adopted a progressive mindset when it comes to automation, and it’s paying dividends in multiple areas. These leaders are using many of the same tools as their industry peers, but they’re employing—and just as importantly—thinking about them differently, which enables them to support strategic business objectives and obtain greater ROI.
Financial services automation leaders effectively deploy the latest automation tools to streamline processes across the enterprise and meet strategic business objectives. Learn their secrets and discover the latest trends in automation in SMA’s 2024 State of Automation in Financial Services Report. And to learn more about how to effectively deploy an end-to-end automation solution in your organization, contact the financial services automation experts at SMA.
*Based on conservative internal calculations by SMA Technologies for OpCon customers that automate at a pace of 105 seconds per task (i.e., 30 seconds to key a manual task, 60-second wait time between tasks, and 15 seconds to verify successful completion of the previous task) at a rate of $34.85 per hour (i.e., average hourly rate for a full-time employee assuming no premium pay for overtime, holidays, nights, or weekends). These calculations don’t include any expenses for errors, re-processing, or other manual operations-related items.
